What If Insights Came Naturally With Data Visualization Software
The importance of data
in guiding business decisions can no longer be ignored. Intuition can
provide a compelling feeling or spark that points you in a certain
direction; but, it's data that allows you to confirm, comprehend, and
quantify your choices. Yet, how often do we find ourselves overwhelmed
by the sheer volume of data, struggling to extract meaningful insights?
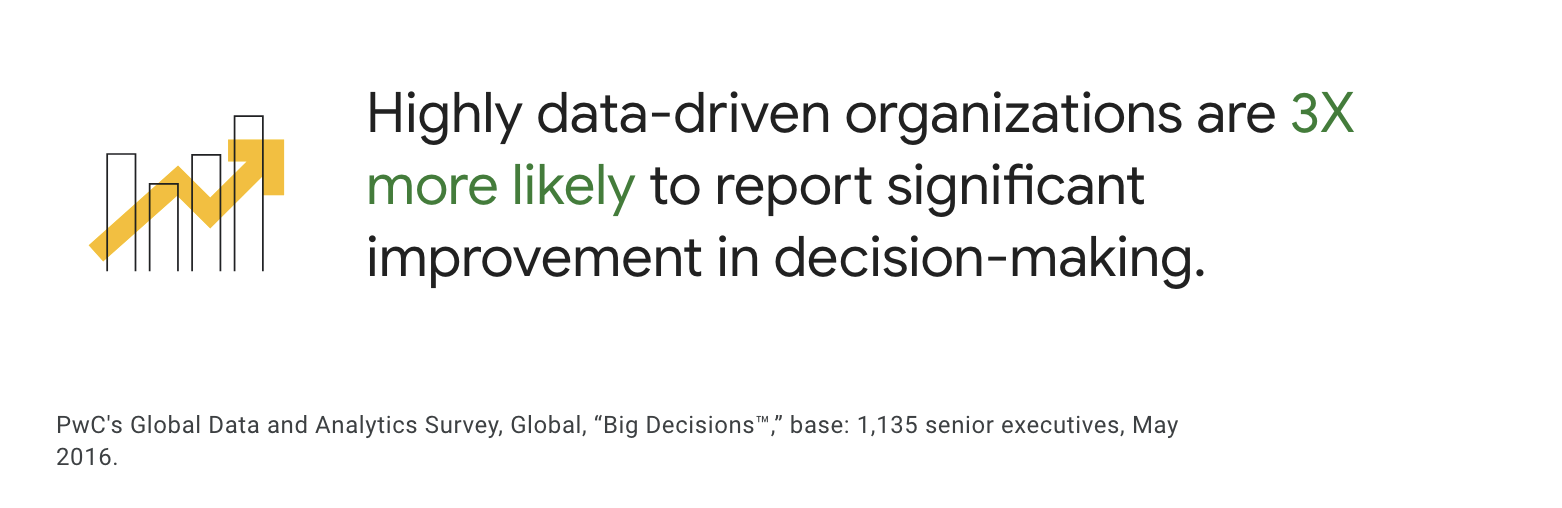
As per a PwC survey of over 1,000 top executives, companies heavily reliant on data are three times more likely to report improvements in their decision-making processes compared to those that use data less frequently.
What if, instead of sifting through complex datasets, the insights you needed came to you as naturally as breathing?
Let’s hold that possibility for a while and explore if data visualization software can help us with this.
The Evolution of Intuitive Insights
It is safe to say that business data visualization is about making sense of data in a way that is both immediate and insightful. This naturally leads us to the question, ‘What is data visualization?’ Essentially, it involves using visual elements like charts, graphs, and maps to convey information, making complex data more accessible and understandable.
The latest advancements in Business Intelligence data visualization tools are embedding AI and machine learning technologies to provide not just visual representations of data, but predictive insights that anticipate trends and outcomes. This leap from static charts to dynamic, foresightful analytics allows businesses to not just react to the present but prepare for the future.
How Can Insights Come Naturally With Data Visualization Software
Advanced Data Parsing and Interpretation
Business Intelligence data visualization tools equipped with advanced parsing algorithms could automatically categorize, clean, and interpret raw data from diverse sources. This process involves machine learning techniques to recognize patterns, anomalies, and correlations within the data, presenting them in an intuitive visual format. Such capability would drastically reduce the preprocessing time and effort, enabling real-time data analysis and insight generation using a Data Management Software.
Example: Imagine a retail chain using data visualization software that automatically parses customer feedback from various channels—online reviews, social media, in-store feedback terminals—and identifies key themes such as product quality concerns or service excellence. This immediate, nuanced understanding allows the chain to address issues proactively and recognize outstanding stores or employees, enhancing customer satisfaction and operational efficiency.
Customizable Visualization Frameworks
Introducing highly customizable business data visualization frameworks that adapt to the specific analytical needs and preferences of different users. By employing user-centric design and adaptive UI/UX principles, these frameworks would automatically adjust the complexity and presentation of business data visualization based on the user's role, expertise, and historical interaction with the tool. This level of personalization enhances the intuitiveness of insights, making them more relevant and actionable.
Semantic Analysis and Contextual Insights
Incorporating natural language processing (NLP) to enable semantic analysis of both structured and unstructured data, data visualization software could offer contextual insights that are deeper than a surface scratch.
By understanding the context surrounding the data, such as market trends, internal business operations, or social media sentiment, these tools can provide insights that are deeply relevant and immediately actionable, moving beyond numbers to interpret the story behind the data with the help of Data Management Software.
Real-Time and Predictive Data Streams
A logistics company utilizes real-time data visualization to monitor its fleet and predict delivery delays due to weather, traffic, or vehicle issues. This predictive insight allows the company to reroute vehicles proactively, inform customers about potential delays, and maintain high service levels. How convenient is it?
Real-time data streams and predictive modeling can be used to offer insights that are not only intuitive but also forward-looking. This involves complex event processing (CEP) engines and time-series forecasting models that analyze data in real-time, predicting future trends and potential impacts on the business. Such capabilities enable organizations to be proactive rather than reactive, optimizing operations and strategies for future scenarios.
Collaborative Analysis and Shared Insights
Improving collaborative features within BI tools to allow teams to share insights, annotate visualizations, and collectively brainstorm solutions. By integrating version control, commentary, and shared dashboards, data visualization software can become a collaborative platform that builds a culture of data-driven decision-making across the organization. This approach encourages diverse perspectives and collective intelligence in interpreting and acting on data insights.
RedShelf's journey from data fragmentation to unified insights via Grow's business data visualization platform showcases the profound impact of collaborative analysis and shared insights. By centralizing scattered data, RedShelf empowered its team to access, share, and act on information seamlessly, fostering a culture of informed decision-making and strategic agility. Grow's ability to merge multiple data sources into a singular metric states the transformative potential of intuitive, collaborative BI tools, making every team member a proactive participant in the company's growth and success.
Integration with Business Processes
Tightening the integration of Business Intelligence data visualization tools with other business processes and systems, such as CRM, ERP, and SCM, to automate the flow of insights into operational workflows. This integration involves API-based connectivity, data federation, and embedding BI capabilities directly into business applications, ensuring that insights are not only intuitive but also seamlessly actionable within the context of daily operations.
Enhanced Security and Governance
Implementing advanced security measures and governance frameworks within data visualization software to protect sensitive data while making insights accessible. This involves encryption, role-based access control (RBAC), and audit trails that ensure data integrity and compliance with regulatory requirements. By prioritizing security and governance, organizations can confidently leverage insights without compromising on data privacy or compliance standards.
What will happen as a result?
If insights came naturally with data visualization software, it would mark a significant leap forward in how we understand, interact with, and leverage data across all sectors of business and research. Let's explore the implications and possibilities of such a transformative development:
Immediate Understanding of Complex Data
Data visualization software that intuitively delivers insights would allow users to grasp complex information without the need for extensive analysis or interpretation. Complex data sets could be understood at a glance, making data-driven decision-making faster and more accessible to everyone within an organization, regardless of their technical expertise.
Enhanced Decision-Making
With insights coming naturally, decision-makers wouldn't have to wait for analysts to interpret data or run through numerous reports to understand trends and patterns. This immediate access to insights would speed up the decision-making process, allowing businesses to react more quickly to market changes, customer preferences, and emerging opportunities or threats.
Democratization of Data
The natural delivery of insights through data visualization would further democratize data, making it accessible and understandable to a broader audience.
“Everyone is constantly checking how sales are doing—was there a spike when we expected there to be? If there’s a dip, what’s going on and what’s causing the problem?”
-says Jon Dussel, CFO of Dolls Kill
Once data has become a part of their routine business, Dussel said it's simple for their teams to keep their eyes on the most important KPIs. Focusing on goals has helped Dolls Kill go from working as a bunch of different units to working as a single team. This has led to better work, happier employees, and more satisfied customers.
Predictive and Prescriptive Analytics
Integrating AI and machine learning, data visualization software could not only make insights intuitive but also predictive and prescriptive. Businesses would benefit from foresight into future trends and behaviors, along with recommended actions to take advantage of opportunities or mitigate risks. This advance would shift the focus from what has happened to what could happen and what actions to take, transforming strategic planning and operational efficiency.
Learn: What are the various types of Data Analysis?
Streamlined Operations and Efficiency
By making insights more intuitive, organizations could streamline their operations, reducing the time and resources spent on data analysis and interpretation. This efficiency gain would allow businesses to allocate their resources more effectively, focusing on innovation, growth, and improving customer experiences.
Altaworx used Grow's BI dashboards to gain a comprehensive view of their revenue funnel, identifying underperforming areas and opportunities for optimization. By creating customizable dashboards and interactive visualizations, they avoided extensive coding and IT expenses, recovering $40,000 in cash flow within 60 days from unpaid invoices. This strategic approach enabled Altaworx to refine their marketing efforts towards more profitable products.
Check out Grow Pricing 2024 Capterra, to see if it meets the expectations on cost and ROI for businesses like yours.
Foster a Culture of Curiosity and Innovation
When insights are intuitive and easily accessible, it encourages a culture of curiosity and continuous improvement. Teams would be more inclined to explore data, ask questions, and experiment with new ideas, knowing that they have the tools to quickly understand the impact and outcomes of their initiatives.
Challenges and Ethical Considerations
While the natural emergence of insights from data visualization software offers numerous benefits, it also presents challenges, particularly in ensuring data accuracy, privacy, and security. There would be a greater need for robust data governance frameworks and ethical guidelines to manage the increased access and reliance on data-driven insights.
Conclusion
The journey towards intuitive insights through data visualization software is driven by the sophisticated fusion of cutting-edge technologies, design that prioritizes the end-user, and seamless integration with core business operations. By tackling both the technological and operational facets, BI tools unlock levels of insight and support for decision-making that were previously unattainable. BI tools like Grow are driving companies into a future marked by agility, innovation, with a robust data-centric approach.
To experience firsthand how our BI solutions can transform your data into actionable insights, we invite you to start your journey with Grow. Sign up today for a 14-day free trial and discover the difference intuitive data visualization can make.


Comments
Post a Comment