It’s Not About Having More Data—It’s About Having the Right Dashboard to Make Sense of It
Do you ever feel overwhelmed by the vast amount of information at your fingertips, rather than empowered by it?
The real challenge isn't collecting more data but finding the right business analytics solutions to make sense of it all. This is especially true in business, where quick and informed decisions are crucial.
Take Edit Suits Co., for example. Co-founded by Patrick Jungo, this premium custom menswear company faced a challenge as its operations expanded across London and Singapore. Patrick noticed that being physically distant from parts of the business made it hard to keep track of important figures like sales, operations, and customer service. As sales grew, the need for a single platform to bring all this scattered information together became clear.

Patrick's solution was Grow, a business analytics dashboard that helped Edit Suits Co. bring all their data into one place, making it easier to make fast, informed decisions. This story highlights a key lesson for all businesses: success lies not in having more data but in having the right tools for business analytics to understand it.
Understanding the Data Overload
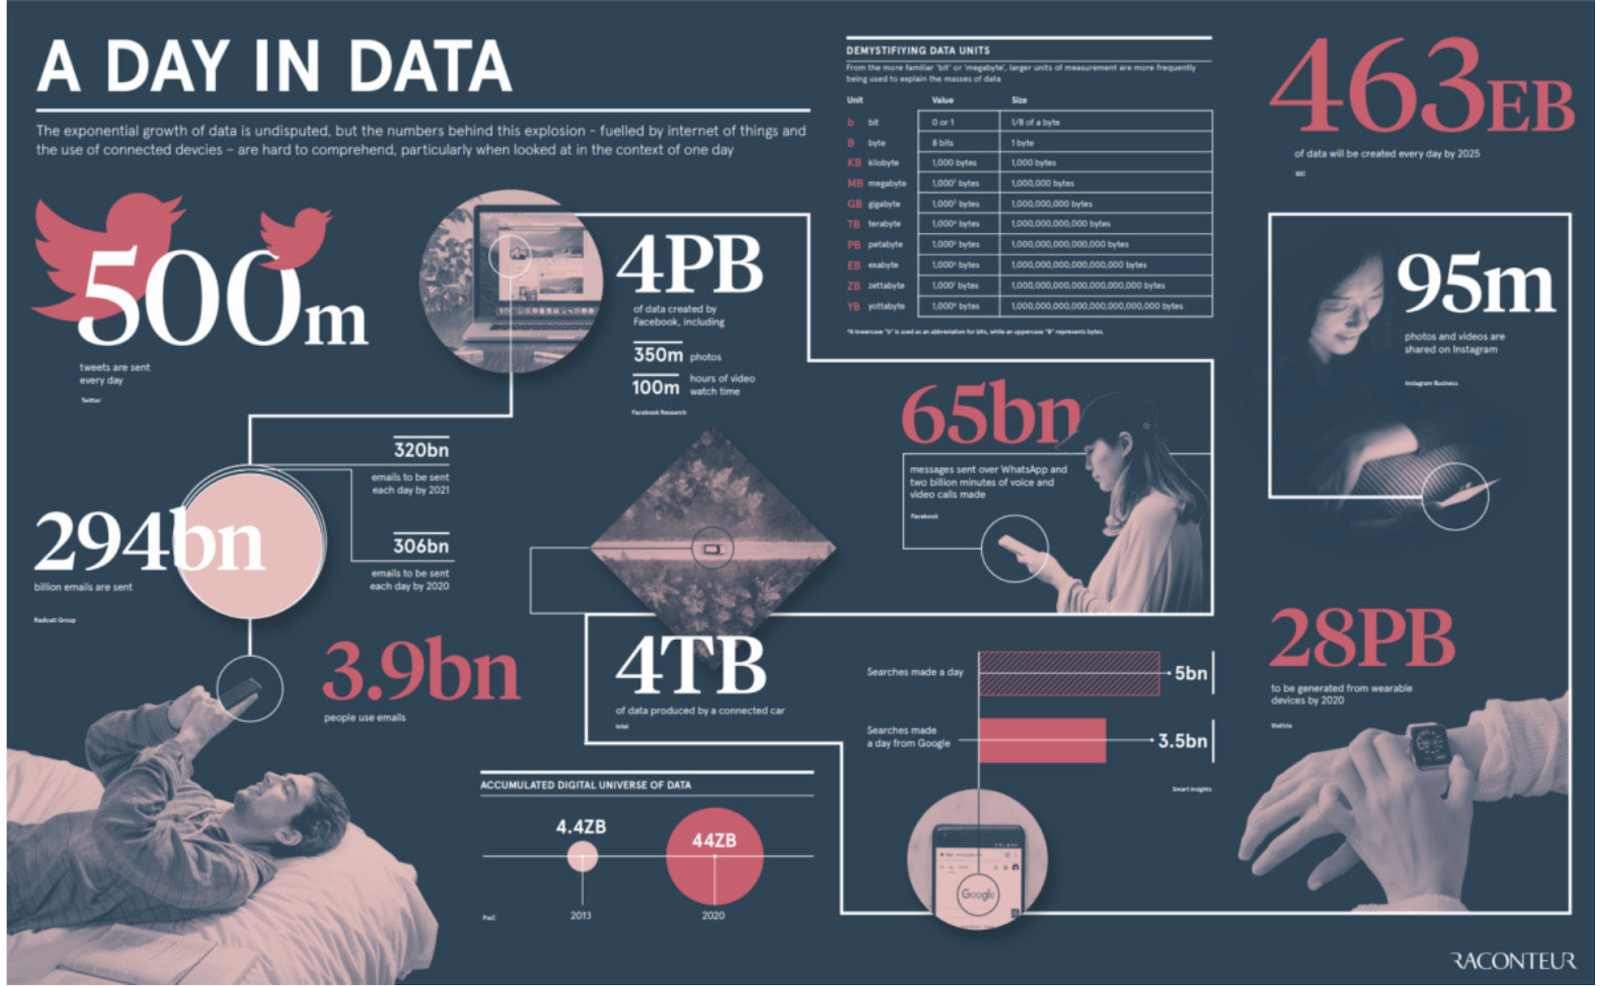
Consider this: by 2025, it's estimated that 463 exabytes of data will be created each day globally.
It’s not surprising, but reflects the digital footprint of modern businesses and the consumers they serve. Yet, with all this data, companies like Edit Suits Co. have found that more data doesn't necessarily equate to better decisions. Without the tools for business analytics to parse and analyze this information, data becomes noise rather than actionable insight.
Defining the "Right" Dashboard
An effective business analytics solution must be highly customizable. A dashboard should serve as a tailored tool reflecting the unique Key Performance Indicators (KPIs) and objectives of an organization, rather than a generic, one-size-fits-all product. This level of customization ensures that every data point presented is both relevant and actionable.
The relevance of a dashboard is determined by its capacity to display data that aligns directly with an organization's strategic goals and benchmarks. A dashboard that excels in relevance effectively filters out unnecessary information, focusing on the metrics critical to business success. With a proficient data analytics company, this is just a piece of cake.
Ease of use, or user-friendliness, is another vital attribute of an impactful dashboard. Its design and interface should be intuitive, allowing users with varied levels of technical skills to navigate and extract value from it. A user-friendly business analytics dashboard promotes broader adoption within a company, empowering everyone, from top executives to department managers, to leverage data analytics in their decision-making processes.
Essential Features of an Effective Dashboard
Interactive Elements
Interactive elements in a business analytics dashboard empower users to explore data beyond surface-level observations. By enabling functionalities such as drill-downs, users can uncover the underlying causes of trends and anomalies within the data. This interactivity facilitates a deeper understanding of the metrics, encouraging a hands-on approach to data analysis.
For instance, a marketing team might use interactive dashboards to analyze campaign performance across different demographics, adjusting filters to view specific data segments. This capability transforms static data into a dynamic exploration tool, fostering informed decision-making and strategic planning.
Grow empowers users with Dashboard Level Filters, a robust feature that revolutionizes how businesses interact with their data. These filters allow you to dynamically adjust metrics, such as changing date ranges or applying custom filters without altering the core settings of your charts.
Imagine the flexibility of viewing your marketing campaign performance over various timeframes—the last 30 days, this year, or any period that matters most to you. This adaptability turns your dashboard from a static display into a dynamic tool, enabling precise, informed decision-making and strategic planning.
Real-Time Data Updates
The pace of change in today's business environment demands that decision-makers have access to the most current information. Real-time data updates in business analytics dashboards ensure that users are not making decisions based on outdated information. This feature is crucial for operations where timing is critical, such as stock inventory management or real-time monitoring of online customer behavior.
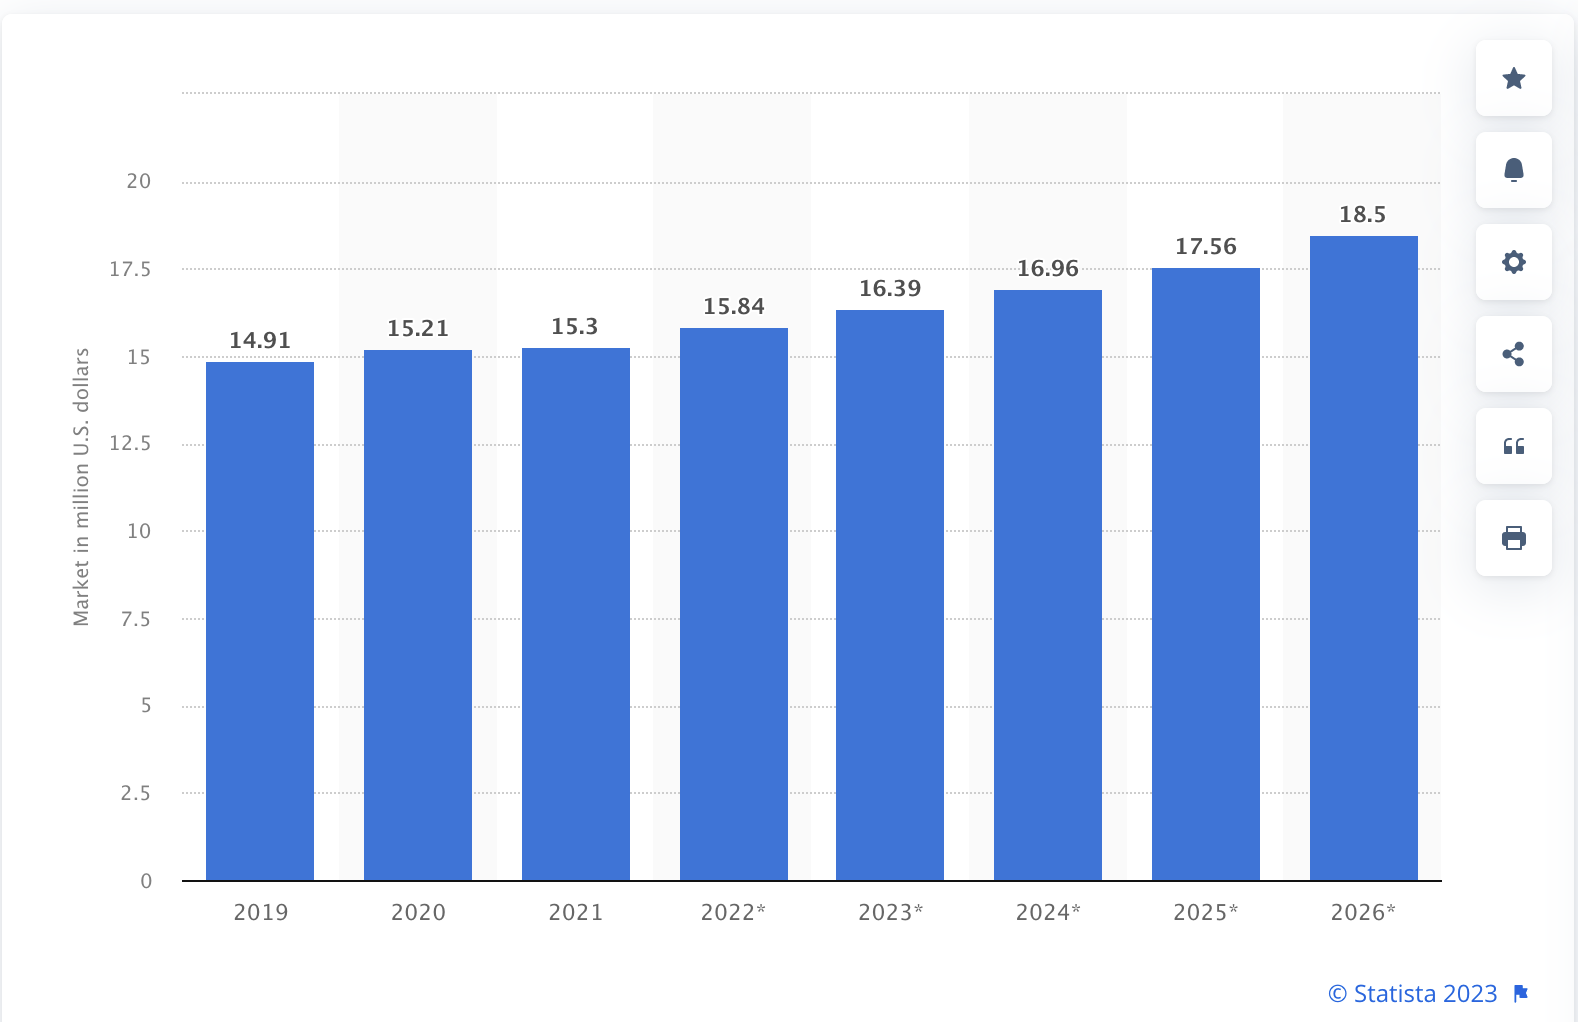
According to a study by MarketsandMarkets, the global real-time analytics market will grow at a rate of 29.9% per year, rising from USD 10.5 billion in 2020 to USD 38.6 billion by 2025. Having up-to-date information at one's fingertips enables businesses to react promptly to emerging trends, mitigate risks, and capitalize on opportunities as they arise. This helps in maintaining a competitive edge.
Predictive Analytics
Predictive analytics utilizes historical data to forecast future trends, offering businesses a glimpse into potential future scenarios. This feature of business analytics solutions leverages statistical algorithms and machine learning techniques to predict outcomes based on past patterns. For example, a retail business might use predictive analytics to forecast future sales trends, helping to optimize inventory levels and plan marketing strategies.
By anticipating future events, businesses can strategize proactively, making adjustments to avoid pitfalls and leverage upcoming opportunities, thus driving growth and innovation. Find a data analytics company that can help you with the proper know-how and implementation of advanced analytics such as these.
Visual Elements
The complexity of data often poses a significant challenge to comprehensibility. Visual elements play a crucial role in making complex data understandable by translating numerical data into visual formats such as charts, graphs, and heat maps. These visuals help to quickly convey key trends, comparisons, and patterns, enabling users to grasp the essence of the data at a glance.
A well-designed business analytics dashboard uses these visual tools to highlight important insights, making it easier for decision-makers to absorb and act on the information.
For instance, a heatmap could be used to identify high-performing regions in sales data, directing focus to areas of success or indicating regions that require attention.
The Advantages of Well-Designed BI Dashboards
Employing business analytics solutions strategically can revolutionize how a company operates. Key benefits include:
Informed Decision-Making: Access to real-time, relevant data allows leaders to quickly adjust strategies, address performance issues, and seize opportunities. This ability to pivot rapidly is essential in today’s ever-changing market landscape.
Efficiency Gains: By automating data collection and presentation, dashboards reduce the need for manual reporting, saving time for analysis rather than data gathering. This can lead to significant cost savings and better use of resources.
Quick Response to Market Changes: Dashboards providing real-time data analytics make businesses more adaptable, enabling them to respond swiftly to trends, consumer behavior shifts, and external factors.
Wrapping Up
Like we said, data is as abundant as the air we breathe; the challenge for businesses isn't gathering more of it but making sense of what they have.
If your business is drowning in data but lacks meaningful insights, it might be time to consider Grow. With its powerful analytics and customizable dashboard, Grow is designed to help businesses like yours make the most of their data. Why not see for yourself? Take advantage of Grow's 14-day free trial and explore how it can transform your data analysis process. For more information on how Grow can cater to your specific needs, including detailed reviews, cost, and features, check out "Grow Reviews Cost & Features GetApp."
Don't let valuable insights slip through your fingers. Empower your business with Grow’s tools for business analytics and turn your data into a strategic asset. Start your journey towards data-driven decision-making today.


Comments
Post a Comment